.png)
Communicating Vessels with the Tap Shut: Inside a Closed Circuit the Risk-Free Rate Splits in Two
September 4, 2026
Valentyn Burianov, Chief Executive Officer, CIRA · CEO Column · September 2026
A risk-free rate is not estimated but observed: it is read off the yield on paper an investor can buy right now. The canon rests on that too: under Aswath Damodaran, the local-currency risk-free rate equals the government bond yield minus the sovereign's default spread, while the base for the dollar and the euro comes from US and German government bonds. The whole construction hangs on that "can". For a Ukrainian institutional investor both of those instruments are out of reach today, so the international table describes somebody else's choice rather than his.
That is where to begin: a risk-free rate is by definition the same everywhere – except in those places where it is not, and Ukraine is one of them. The canon is not wrong – it silently assumes a condition almost nobody in Ukraine checks. And that condition does not fall away for the hryvnia alone. The first issue of this column ended on the claim that the market sets the price of money and the regulator only accompanies it; the less comfortable sequel is that the market does so only where it is let in. The stake is not cosmetic: the risk-free rate is the first term of every other rate in the model – the cost of equity is that rate plus the equity risk premium (ERP) and the country risk premium (CRP) – and one percentage point (p.p.) of error moves a company's valuation by 5–20 %.
Then comes the theory itself, and it is remarkably clean. A risk-free rate has only two components: a real reward for postponing consumption – the time premium – and compensation for the inflation of the currency it is quoted in. Inflation belongs to each currency alone, while the time premium is roughly the same everywhere. Hence the textbook sentence: the difference between the risk-free rates of two currencies is, in essence, the difference in their inflation rates, and a rate in one currency can therefore be converted into another through the inflation differential.
Now the question usually skipped at this point: why is the time premium roughly the same everywhere? It is not an axiom but an equilibrium, and arbitrage is what produces it – a process that looks entirely mundane. A fund with dollar liquidity sees paper in another currency where the real reward over the same horizon is higher, and moves the money there: its buying lifts the price of that paper and pushes the yield down. The reverse case works the same way: a holder of a currency that pays less in real terms at home sells the domestic paper and buys abroad, and that sale lifts the yield here. No single trade equalises anything – what equalises is the flow of such trades, and that flow compresses the difference in time premia for as long as the move still pays, leaving mostly the difference in inflation between the currencies.
So the identity that opens every textbook calculation is not a definition but an equilibrium result, and it holds for exactly as long as arbitrage can run. Communicating vessels equalise not because the vessels are alike but because liquid flows between them, and that flow is arbitrage. Shut the tap, and the levels diverge in every vessel, whatever the formula says.
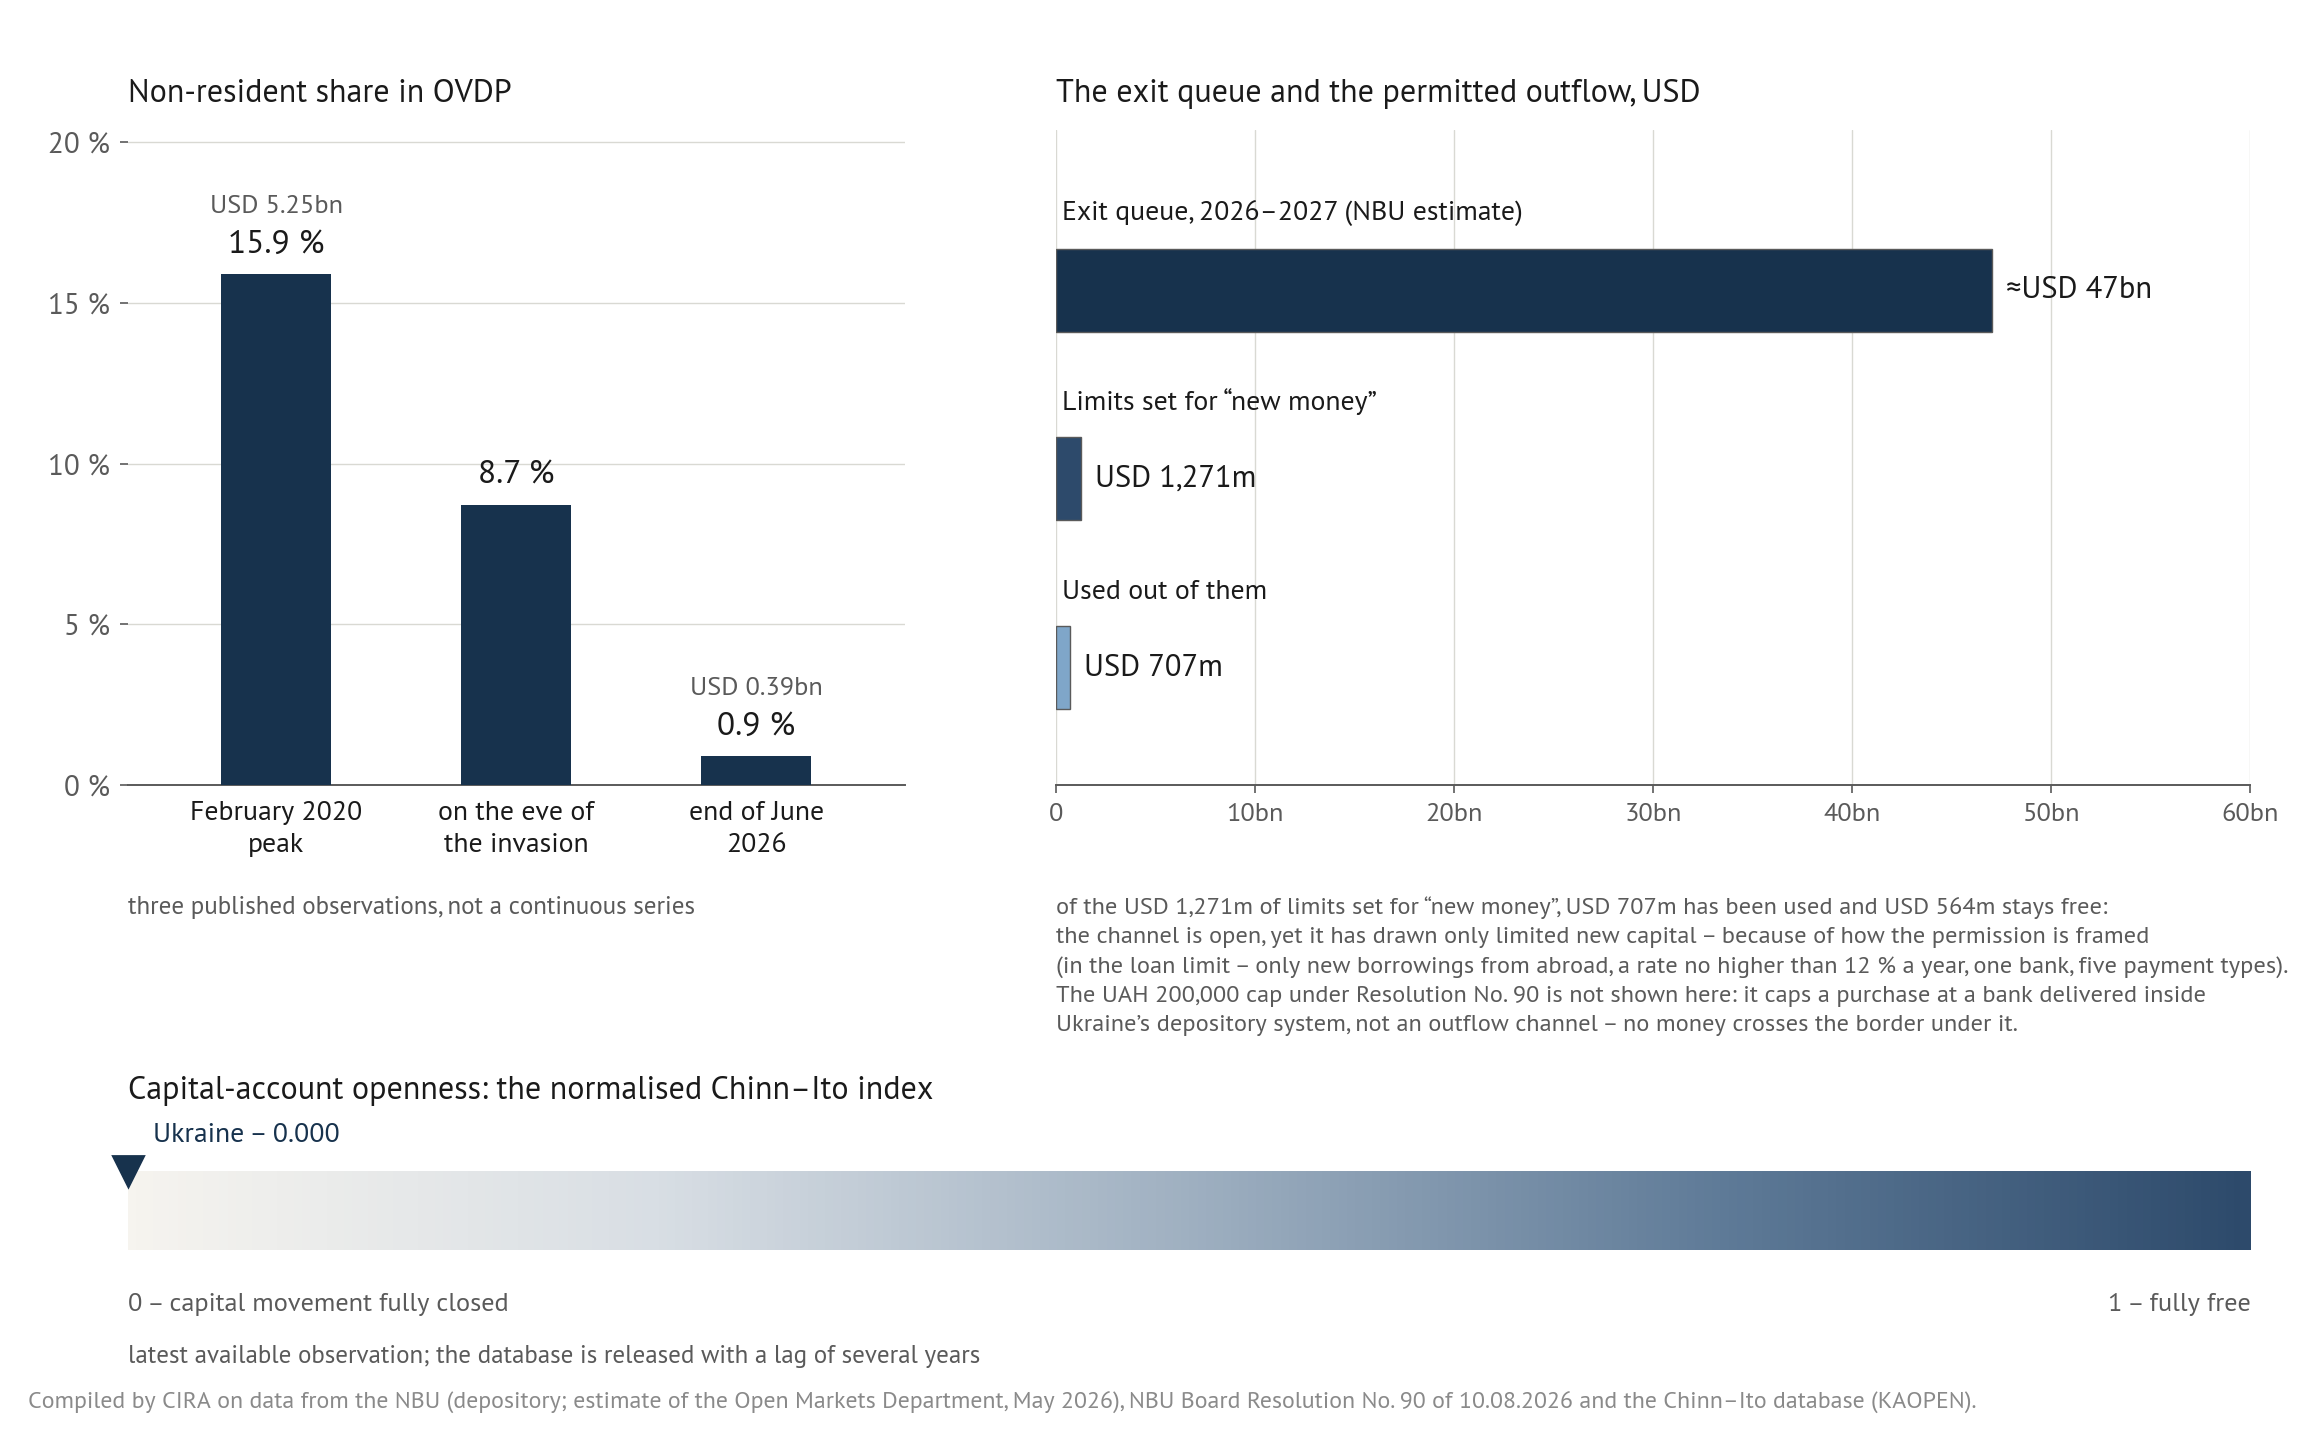
In Ukraine the tap is shut by regulation: the wartime currency regime rests on Resolution No. 18 of the Board of the National Bank of Ukraine (NBU) of 24.02.2022, whose paragraph 14 allows cross-border transfers of currency values out of Ukraine only for a defined list of operations – "everything is prohibited except what is permitted" – and the purchase of foreign securities is not on it now either. Resolution No. 90 of 10.08.2026 (in force since 11.08.2026) did not widen that list: it added a separate paragraph 12-19, under which a bank may sell securities of foreign issuers to its own individual client, delivered inside Ukraine’s depository system, within a combined UAH 200,000 per calendar month at one bank, shared with non-cash currency and banking metals. No money crosses the border under that construction, and a transfer to an account with a broker abroad remains outside paragraph 14’s list: even this easing happens inside the circuit rather than through its wall. Ukraine’s normalised Chinn–Ito index of capital-account openness stands at zero at its latest available observation, in a database that itself lags by several years. While the regime holds, a position in US Treasuries (UST) or German government bonds (Bunds) cannot realistically be built from inside the circuit.
The closure is visible outside the regulatory text too: the exit queue on restricted operations runs at around USD 47bn for 2026–2027 on the NBU's estimate, roughly USD 19bn of it already past due. This is no rebuke to the regulator: any protective regime has a price, and we put the contribution of the restrictions themselves over 2022–2025 at roughly USD 9–10bn. The arbitrageur who ought to equalise the time premia does not take the trade here: not because he cannot see the difference, but because a transfer of that size will not go through.
With arbitrage switched off, the circuit becomes a separate financial ecosystem: about a third of the hryvnia segment of domestic debt, UAH 656bn out of UAH 1,834bn, is held by the NBU itself. A risk-free rate cannot be imported here: it has to be built anew, out of what actually trades inside. And this is not about the hryvnia alone: neither UST nor Bunds are within reach of capital locked inside, while a foreign-currency deposit at a Ukrainian bank or foreign-currency OVDP carries a different, Ukrainian risk. So in every currency of the circuit the rate stops being a single object: an investor pricing hryvnia cash flows from outside and capital locked inside ask different questions, and rather than pick a winner we publish both definitions each month – for the hryvnia so far.
As a researcher I find this case interesting: theory rarely gets to watch what happens to its most basic constant once the mechanism that keeps it constant is removed. Finance has seen few complete stoppages of that mechanism – Cyprus, Greece, Argentina, Iceland, Nigeria – and as at July 2026 the Ukrainian regime has run for 53 months. But the tap was shut by a war, not for an experiment: the phenomenon is what interests me, not its cause, and no natural experiment is worth that price. And for those inside the circuit there is no choice between studying it and not – only between measuring and guessing.
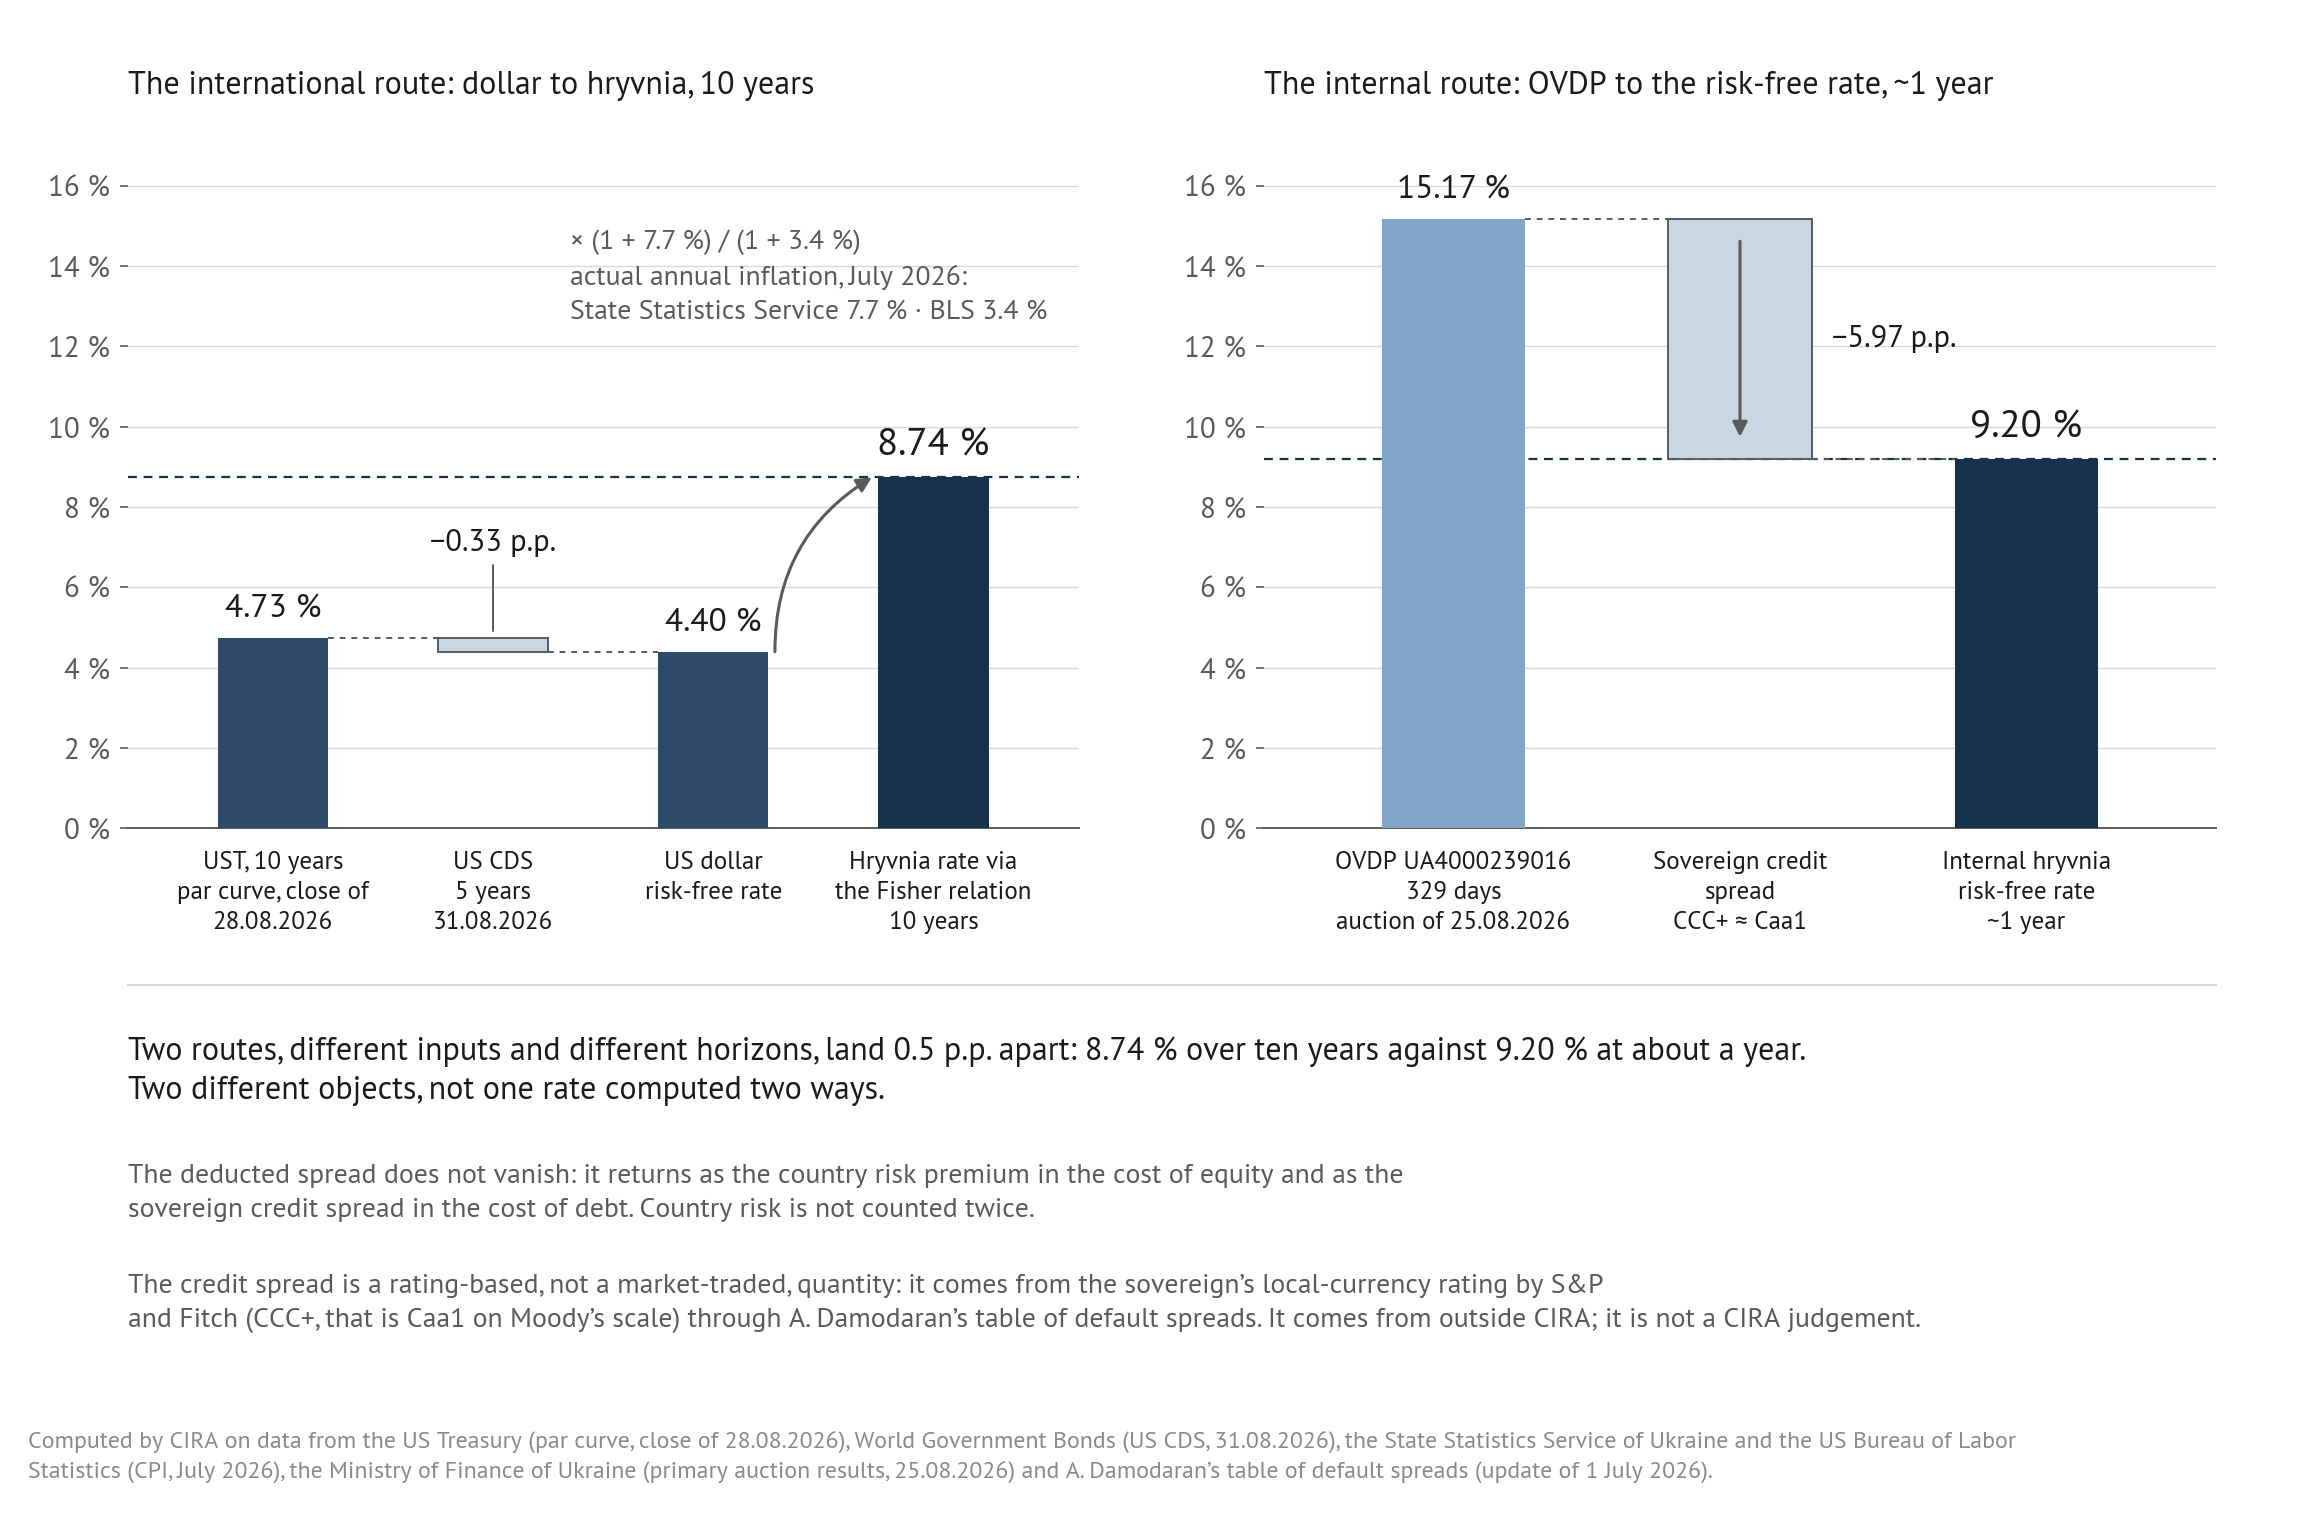
The first definition is the international view, on a 10-year horizon – what the hryvnia rate would be if arbitrage were working. The dollar risk-free rate is the yield on 10-year US Treasuries minus the US CDS spread (credit default swap – the market price of insurance against default): the United States no longer carries an Aaa/AAA rating, so Treasuries are only quasi-risk-free. In the September issue, 4.73 % minus 0.33 p.p. gives 4.40 %, shown in the summary table as 4.4 %. The euro needs no subtraction: 10-year Bunds are rated Aaa/AAA, so the rate stands at 3.3 % – a rate in its own right for euro cash flows, not a second base for the hryvnia, which we derive from the dollar rate alone. The dollar and the euro here are rates for whoever can reach the world's markets.
The Fisher relation derives the hryvnia rate from the dollar rate through actual year-on-year inflation in both currencies for July 2026 – 7.7 % from the State Statistics Service of Ukraine against 3.4 % from the US Bureau of Labor Statistics (BLS) – and gives 8.7 %. Actual rather than expected inflation is deliberate: an observed number leaves no room for subjective assumptions. This route openly borrows the identity that arbitrage produces beyond the circuit, which is why it anchors any long horizon – the investor looking in from outside included.
The second definition is the circuit itself. The closest thing to a risk-free instrument here is OVDP – the hryvnia securities Ukraine's Ministry of Finance places at primary auctions – but the sovereign is not default-free even in its own currency, so we subtract from that yield the credit spread implied by the sovereign's S&P and Fitch local-currency rating, taken from Damodaran's table of default spreads. That is a rating-based figure from outside CIRA rather than a CIRA judgement on the sovereign's creditworthiness, and the national rating scale plays no part in the calculation. At the auction of 25.08.2026 the weighted average yield on the 329-day issue was 15.17 %; subtracting a spread of 5.97 % gives 9.20 %, shown in the summary table as 9.2 %. This is a computed anchor, not a yield anyone can buy: no outside identity is borrowed here.
Every step here is a choice: the benchmark is the one-year point, the shortest clean market point on the curve, and each month we reconcile the rate against an independent bottom-up estimate. On actual data, inflation plus real growth of the economy give 8.3 % against the market's 9.2 %, a divergence of 0.9 p.p.; on household inflation expectations of 9.95 % over twelve months in the NBU's July survey, the same macroeconomic estimate rises to roughly 10.5 %. Showing only the check that agreed would pass a choice of input off as the absence of one; the gap itself measures how much future disinflation the OVDP market has priced in and the household survey has not. The bottom-up figure is a check, not a standalone estimate, and we explain any divergence in the issue commentary rather than leave it unsaid.
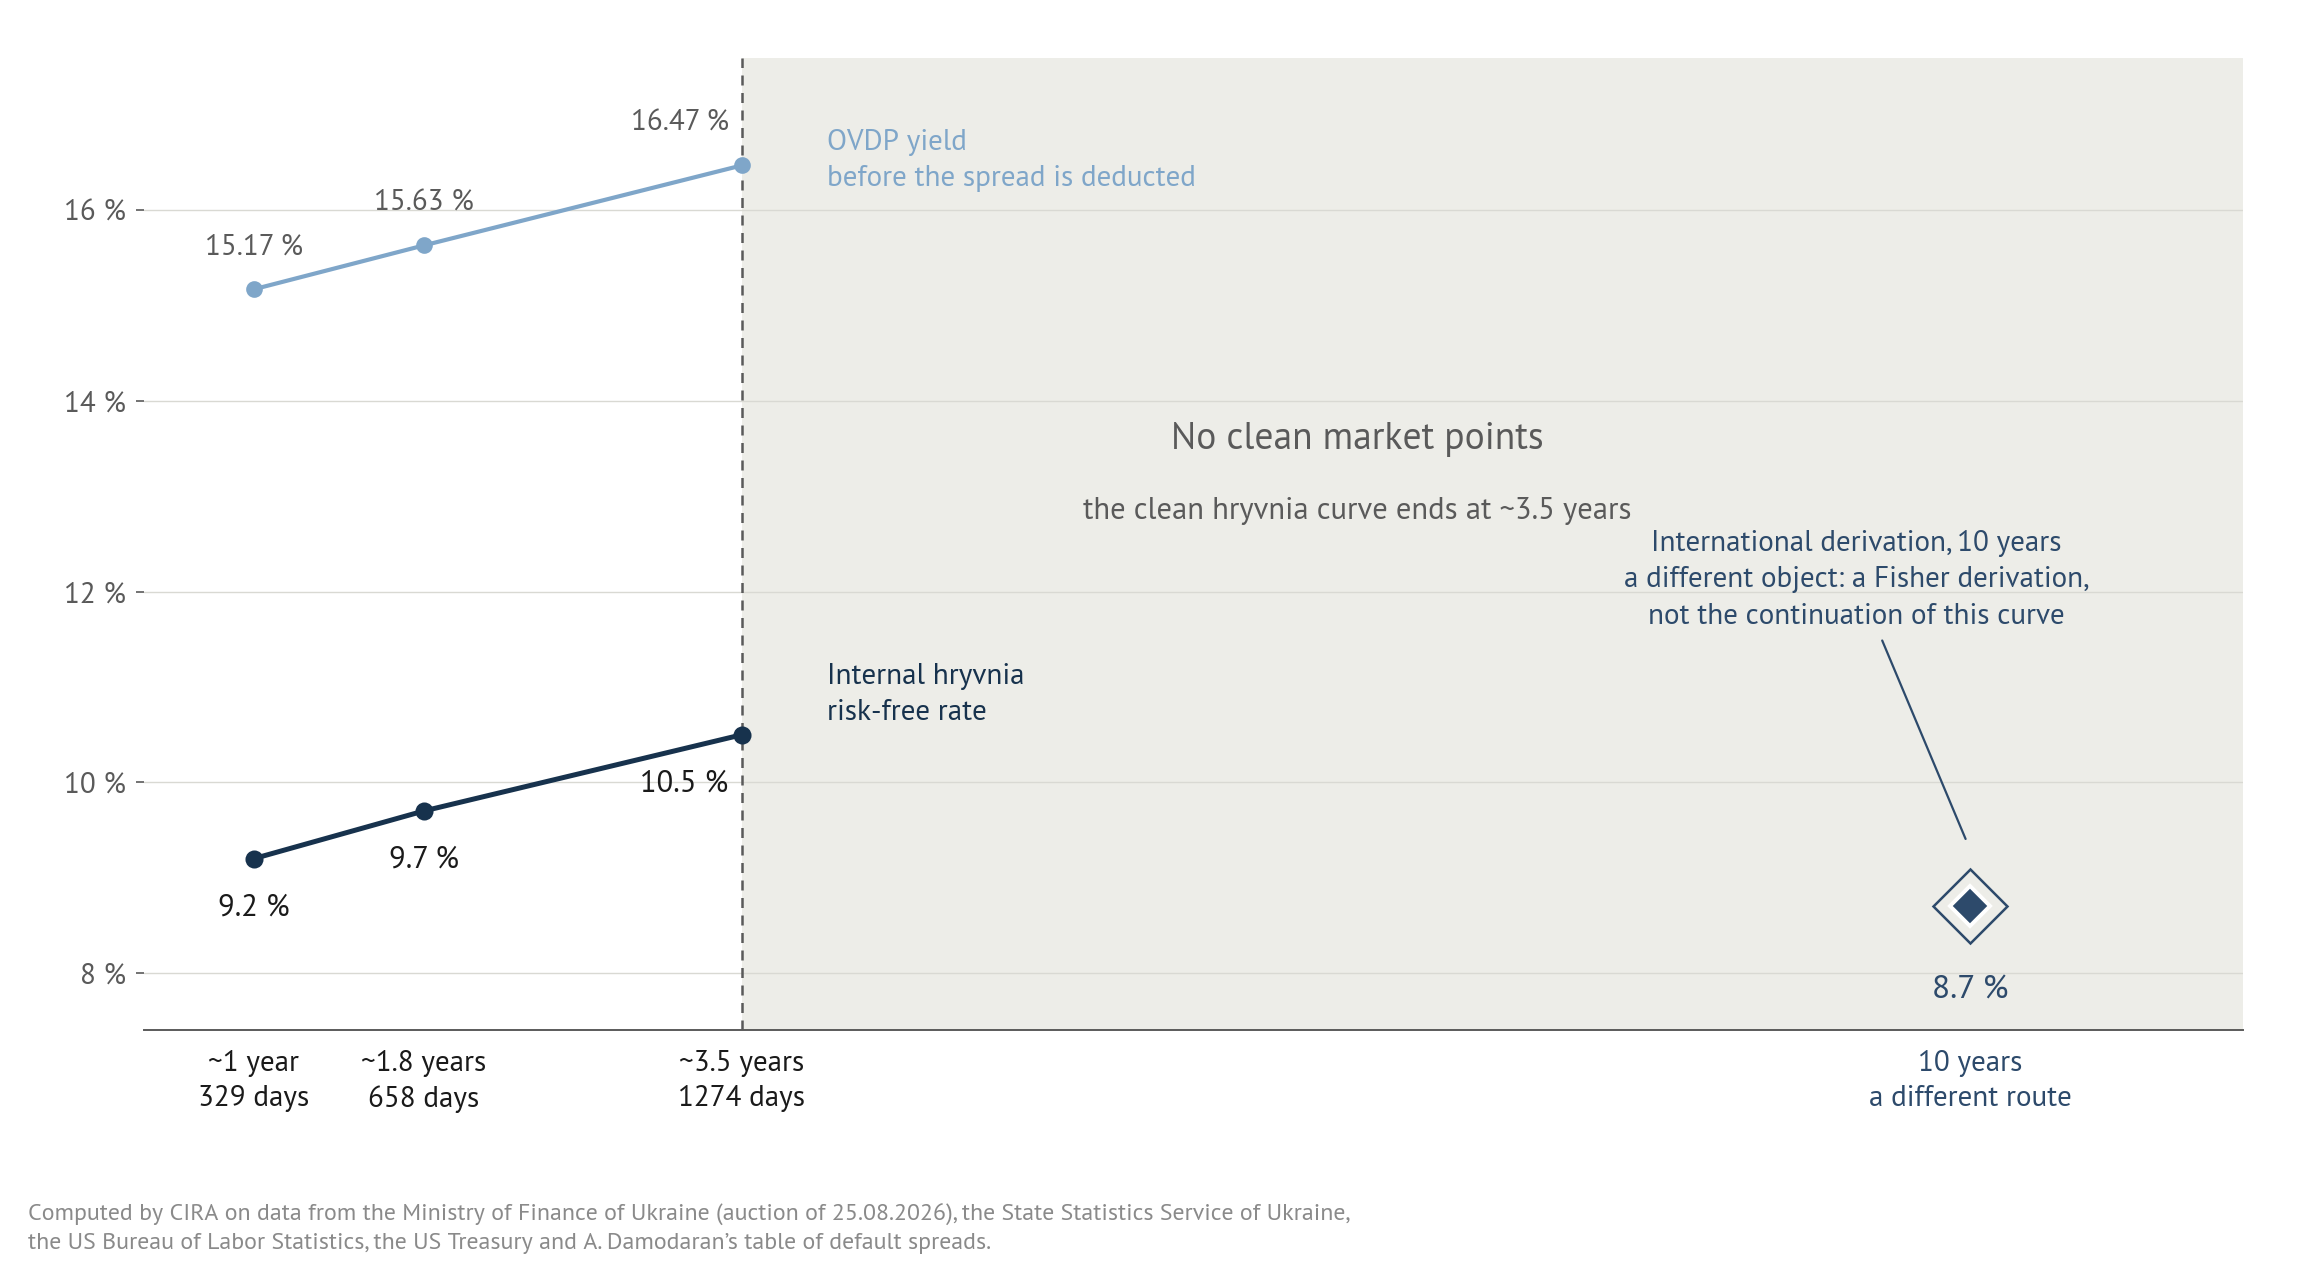
This month the two definitions diverge: the international derivation gives 8.7 %, the internal one-year point 9.2 %, a distance of 0.5 p.p. between them. A month ago that distance was 0.1 p.p., and the coincidence confirmed nothing – current annual macro conditions simply happened to meet. The gap is the more informative of the two: the numbers part because they measure different things, not because one rate has been computed two ways. Yet it shows less than it might seem: over a single month it was made not by the OVDP market repricing risk but by a new edition of the default-spread table – the deducted sovereign spread moved from 6.37 % to 5.97 %, while the yield on the one-year issue itself shifted by 0.02 p.p. What the distance between the two definitions measures will show only over a longer series: the derivation moves with the inflation differential, the internal point with the OVDP market. Beyond the one-year point, the internal curve offers two further clean points: 9.7 % at 658 days and 10.5 % at 1274 days. There, at ~3.5 years, it ends, and a line cannot be extended into territory where no clean market point exists.
An attentive reader's first objection is that country risk is counted twice. It is not: the deducted spread comes back as a separate term – the country risk premium in the cost of equity, the sovereign credit spread in the cost of debt – so country risk is counted once, and on the debt side subtraction and addition cancel exactly, reproducing the observed yield. The second objection is sharper: the internal rate sits below the NBU's key policy rate of 15.5 %, in force since 31.07.2026. There is no absurdity here: this is the shadow yield of a hypothetical default-free hryvnia issuer, not a rate at which anyone places money. Even one-year OVDP trade below the key rate, 15.17 % against 15.5 % – another sign of the closed circuit.
I state the limits plainly, because they are part of the product. The internal rate is not a 10-year rate and cannot be one: stretching it that far would pass invention off as observation. The credit spread is rating-based rather than market-traded, from a table calibrated on long-dated dollar instruments, so for a one-year hryvnia point neither maturity nor currency matches, in a direction that is unknown. The international derivation rests on the current rather than the long-run inflation differential, and the dollar rate is overstated by roughly 0.1 p.p.: the monthly cycle uses the 5-year US CDS, not the 10-year one. The most important limit is not methodological but temporal: the split into two definitions holds exactly as long as the wartime regime does – a property of the regime, not of the hryvnia.
The conclusion is uncomfortable for anyone who wants a single figure, and more honest for that reason. To me, two numbers side by side are not a sign of uncertainty but an accurate description of a country where capital inside and outside live under different rules. For an economy that will be rebuilt with both at once, that is no academic detail: each investor is entitled to see what the rate discounting their cash flows is made of. CRP comes next in this column, then ERP. The vessels remain connected by design, and one day the tap will be opened – arbitrage will flow again and bring the levels back together, without any tables of ours. While it stays shut, the level in each vessel is measured separately.
The full calculation, with its steps, its sources and the limits of the method, is on the page Risk-Free Rates: Hryvnia · US Dollar · Euro (https://cira.com.ua/en/rinkovi-dani); the Ukrainian version (https://cira.com.ua/rinkovi-dani) carries the same numbers. Estimates of what the closed circuit costs the economy are in the CIRA study The cost of currency restrictions: $9–10 billion for 2022–2025 (https://cira.com.ua/en/market-reports/cina-valyutnih-obmezhen-9-10-mlrd-dol-za-2022-2025-roki) of 27 July 2026.
The CEO Column is the author's personal analytical view. It is not a credit rating, a rating action or an official position of Credit Intelligence Rating Agency LLC; the Agency's rating decisions are taken solely by its Rating Committee. The Column does not comment on CIRA's rating actions, the Agency's clients or potential rated entities.
